AtaGenix Laboratories

AtaGenix Laboratories
Release time: 2024-11-05 View volume: 1266
Project Snapshot — End-to-end antibody gene sequencing and validation case: PCR amplification of VH/VL variable regions, colony PCR confirmation, Sanger sequencing with >96% germline identity, and in-frame junction analysis — demonstrating AtaGenix’s complete antibody cloning and QC workflow.

Figure 1: Schematic of antibody coding gene structure, including 5’ and 3’ untranslated regions (UTRs), illustrating heavy and light chain organization.
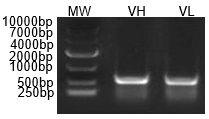
Figure 2: PCR amplification of antibody heavy (VH) and light chain (VL) variable regions, confirming successful cloning for downstream sequencing.

Figure 3: Colony PCR validation gel. M: DL10000 DNA Marker. In-frame amplification bands confirm successful insertion of VH and VL sequences into the cloning vector.
| Sequence | V-GENE and Allele | Functionality | V-REGION Identity (%) | J-GENE and Allele | D-GENE and Allele | AA Junction | Junction Frame |
|---|---|---|---|---|---|---|---|
| VH | Musmus IGHV1-71-16*01 F | Productive | 96.53% | Musmus IGHJ4*01 F | Musmus IGHD2-4*01 F | CAITTGYAMDYW | In-frame |
| VL | Musmus IGKV4-74*01 F | Productive | 97.51% | Musmus IGKJ4*01 F | — | CHQYYRSPFTF | In-frame |

Figure 4: Antibody heavy and light chain sequence analysis. High germline identity (>96%) confirms accurate cloning and alignment of VH and VL regions.

Figure 5: Sanger sequencing chromatogram of antibody VH and VL chains. Clean, non-overlapping peaks confirm sequencing accuracy and reliable variable region identification.
Need expert support for antibody cloning, sequencing, and validation? AtaGenix delivers end-to-end custom antibody services — from design to QC.
Talk to Technical SupportResponse within 24 hours

Contact Us
+86-27-65523339
info@atagenix.com
Building C, R & D Building, No. 666, Shendun 4th Road, Donghu New Technology Development Zone, Wuhan